The Hunt for the Magenta Screen
I recently got the idea of getting into graphics programming again to learn a bit more about modern graphics APIs. So I started to create a window using the Windows API and setup an OpenGL context. Before drawing even a triangle, I wanted to just see a simple magenta background color:
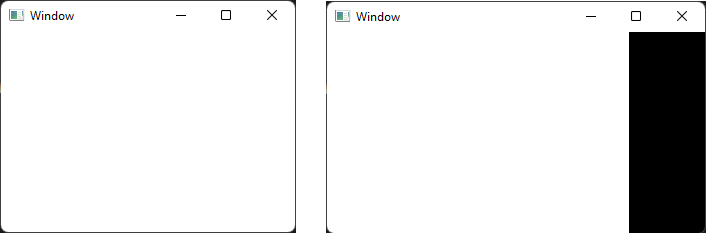
glClearColor(1.0f, 0.0f, 1.0f, 1.0f);
glClear(GL_COLOR_BUFFER_BIT);
SwapBuffers(deviceContext);
However, my window remained white and showed black borders when I resized it.
Modern OpenGL Setup
What could possibly go wrong in such a simple OpenGL program? My first thought was that it must be something during the initialization of OpenGL. See, on Windows you have to jump through some hoops to get a modern OpenGL context (Khronos guide on creating an OpenGL context on Windows)
- Create a dummy window
- Setup some archaic pixel format magic
- Create a legacy OpenGL context
- Load modern OpenGL functions
- Setup a modern OpenGL context
static void gl_initialize() {
    HWND dummyWindow = CreateWindowExW(
        0, L"STATIC", L"DummyWindow", WS_OVERLAPPED,
        CW_USEDEFAULT, CW_USEDEFAULT, CW_USEDEFAULT, CW_USEDEFAULT,
        NULL, NULL, NULL, NULL);
    HDC dc = GetDC(dummyWindow);

    PIXELFORMATDESCRIPTOR desc = {};
    desc.nSize = sizeof(desc);
    desc.nVersion = 1;
    desc.dwFlags = PFD_DRAW_TO_WINDOW | PFD_SUPPORT_OPENGL | PFD_DOUBLEBUFFER;
    desc.iPixelType = PFD_TYPE_RGBA;
    desc.cColorBits = 24;

    int format = ChoosePixelFormat(dc, &desc);
    DescribePixelFormat(dc, format, sizeof(desc), &desc);
    SetPixelFormat(dc, format, &desc);

    HGLRC rc = wglCreateContext(dc);

    wglMakeCurrent(dc, rc);

    // Load modern OpenGL functions here via wglGetProcAddress
    wglCreateContextAttribsARB = (wglCreateContextAttribsARBF*)wglGetProcAddress("wglCreateContextAttribsARB");

    wglMakeCurrent(dc, nullptr);
    wglDeleteContext(rc);
    ReleaseDC(dummyWindow, dc);
    DestroyWindow(dummyWindow);
}
Maybe something goes wrong during the OpenGL setup. So I added more code to handle all return values of these functions and check for potential errors. It turned out that all functions indicated success, so the OpenGL setup seems to work. Or at least Windows and OpenGL think that it has worked.
OpenGL Debugging
At this point, I thought that the problem must be somehow OpenGL related. I remembered from the old OpenGL days that debugging was quite frustrating, since every OpenGL function could silently fail and you would only realize later that something went wrong. Luckily, modern OpenGL has a simpler way to debug any errors that may occur: Debug Output
First, we define a callback that we can later register to be called for any OpenGL error:
void ourGlErrorCallback(GLenum source, GLenum type, GLuint id, GLenum severity,
    GLsizei length, const char* message, const void* userParam)
{
    OutputDebugStringW(L"GL DEBUG: ");
    OutputDebugStringA(message);
    OutputDebugStringW(L"\n");
    if (severity == GL_DEBUG_SEVERITY_NOTIFICATION) {
        // Do not break on debug notifications
        return;
    }
    DebugBreak();
}
Then, we can register the callback and enable debugging.
Note: In order to use these functions, you need to load them via
wglGetProcAddress.
glDebugMessageCallback(ourGlErrorCallback, nullptr);
glEnable(GL_DEBUG_OUTPUT_SYNCHRONOUS);
Now, we should get a log message everytime an OpenGL error occurs and our debugger should break if it is anything more than a notification. Since we enabled the synchronous debug mode, we should be able to see the culprit by simple going up the stack trace once the debugger breaks.
I start the debugger and ... nothing. What? That does not really make sense to me. But, since I seem to not make progress with the built-in debugging tools, let's get something bigger to investigate why I still cannot see my magenta screen.
Consult RenderDoc
RenderDoc is a powerful graphics debugger that allows developers to inspect the rendering state of an application. It supports all popular rendering APIs including OpenGL. So I downloaded the most recent version and set up the launch settings for my OpenGL application.
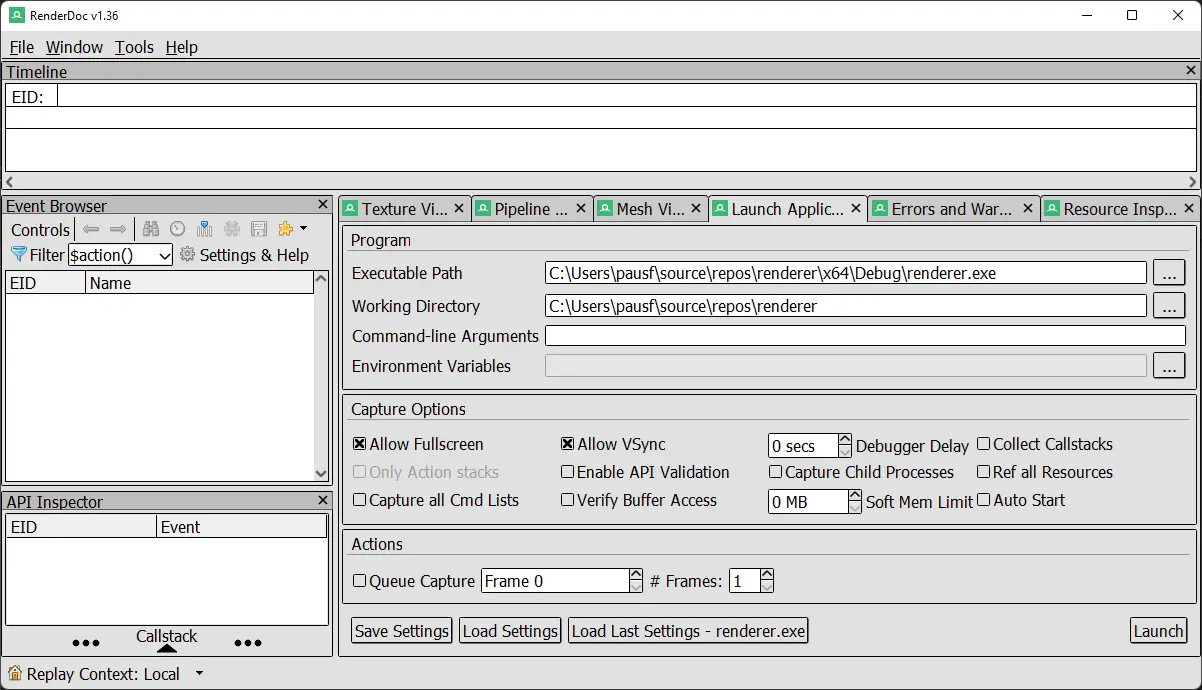
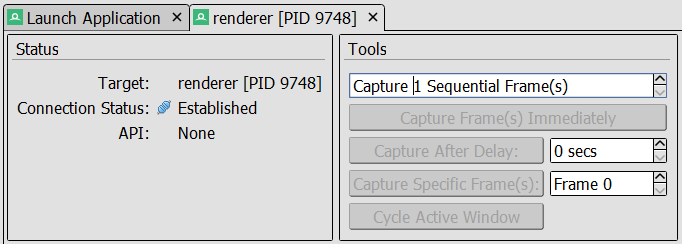
Without hesitation, I click on the launch button. But all the buttons to capture and analyze a frame a greyed out. Furthermore, RenderDoc reports "API: None". This means, it does not even detect that we are using OpenGL. Although all our calls to OpenGL seem to succeed without any errors. Googling for the "API: None" behavior did not yield any fruitful results. This is becoming quite the rabbit hole.
The Windows Message Loop
At this point, I was getting a bit desperate. But this desperation lead me to question some basic things. Am I actually rendering any frames? If my OpenGL code is never called, then there would be no errors that the OpenGL debugging could catch. Also, RenderDoc could not capture any frames, if there are none. So I decided to look into the render and message loop again:
g_running = true;
while (g_running)
{
    MSG msg = {};
    while (PeekMessageW(&msg, window, 0, 0, PM_REMOVE))
    {
        TranslateMessage(&msg);
        DispatchMessageW(&msg);
    }

    glClearColor(1.0f, 0.0f, 1.0f, 1.0f);
    glClear(GL_COLOR_BUFFER_BIT | GL_DEPTH_BUFFER_BIT);
    SwapBuffers(deviceContext);
}
That is quite a minimalistic render loop.
It uses the
PeekMessageW
function to query Windows' message queue in a non-blocking fashion.
The PM_REMOVE parameter tells PeekMessageW to remove the message from the queue.
We handle all messages that are currently in the queue.
Then, we proceed to do our OpenGL rendering and, finally, swap our rendered image to the screen
via SwapBuffers.
I start the debugger and put a break point on the glClearColor line.
It does not trigger. This is the big "duh!" moment.
I debug into the message loop and see a
WM_PAINT message.
The next message is WM_PAINT again and again. It does not stop.
Why is there in infinite amount of WM_PAINT messages in my message queue?
Some Messages are More Equal than Others
If we look into the documentation for WM_PAINT, we can directly find something that hints at our problem:
The WM_PAINT message is sent when the system or another application makes a request to paint a portion of an application's window. The message is sent when the UpdateWindow or RedrawWindow function is called, or by the DispatchMessage function when the application obtains a WM_PAINT message by using the GetMessage or PeekMessage function.
Apperantly the
DispatchMessageW
function can send another WM_PAINT message if I just received one.
Why would it do that?
Because I did not follow the prescribed behavior when handling the message.
Here is a shortened version of my
window procedure:
LRESULT CALLBACK MainWndProc(HWND window, UINT message, WPARAM wParam, LPARAM lParam)
{
    switch (message)
    {
    case WM_CREATE:
        return 0;

    case WM_PAINT:
        return 0;

    // Process other messages.

    default:
        return DefWindowProc(window, message, wParam, lParam);
    }
}
Returning zero indicates that we processed the message.
However, WM_PAINT expects us to do a little bit more.
We get the message if some region or the whole windows has been marked as dirty, i.e. it needs repainting.
In a non-OpenGL program, we would identify the dirty region, paint it again and mark it as clean.
This is done via the
BeginPaint
and
EndPaint
functions.
If we do not do this, Windows thinks that our windows stays dirty and decides to generate a new WM_PAINT
message again.
To fix this, we need to mark our window as repainted:
case WM_PAINT:
{
    PAINTSTRUCT ps;
    HDC dc = BeginPaint(window, &ps);
    EndPaint(window, &ps);
    return 0;
}
Alternatively, we could have let Windows handle this with the default window procedure:
case WM_PAINT:
    return DefWindowProcW(window, message, wParam, lParam);
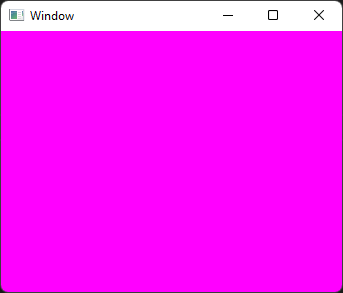
A Long Journey's End
Finally, we have achieved our goal, a magenta window:
So what have I learned on this journey? Honestly, I am not sure. It seems that my misunderstanding of how Windows handles painting has lead my down the rabbit hole of OpenGL debugging. In the end, the bug had nothing to do with OpenGL. Nonetheless, I feel a little bit more prepared for any OpenGL errors and debugging sessions that I might face in the future.